This page exists to break down NFL kicking performance in a clear, comparable way
so viewers can understand what makes a good kicker beyond total points scored.
By organizing the data by distance, accuracy, and volume, the page allows users to
quickly compare high and low performers, identify consistency patterns, and see
how different kicking skills contribute to overall effectiveness.
Click a player's name to see season field-goal details.
High vs. Low Performers: Short–Mid Range Consistency
Category
Rank
Kicker
20–29
30–39
High Performer
1
Ka'imi Fairbairn
8–8
11–11
High Performer
5
Will Reichard
6–6
9–9
Low Performer
10
Blake Grupe
9–9
10–12
Low Performer
7
Chase McLaughlin
6–6
9–11
In the short-to-mid range, elite kickers demonstrate near-perfect reliability.
Fairbairn (ranked 1st overall) and Reichard (ranked 5th) converted every attempt under 40 yards,
reinforcing why these distances are considered “automatic” for top-tier specialists.
In contrast, lower-ranked kickers like Grupe and McLaughlin show noticeable drop-offs,
particularly from 30–39 yards, where misses begin to accumulate despite similar attempt volume.
This discrepancy highlights how small inefficiencies can separate league leaders from the middle tier.
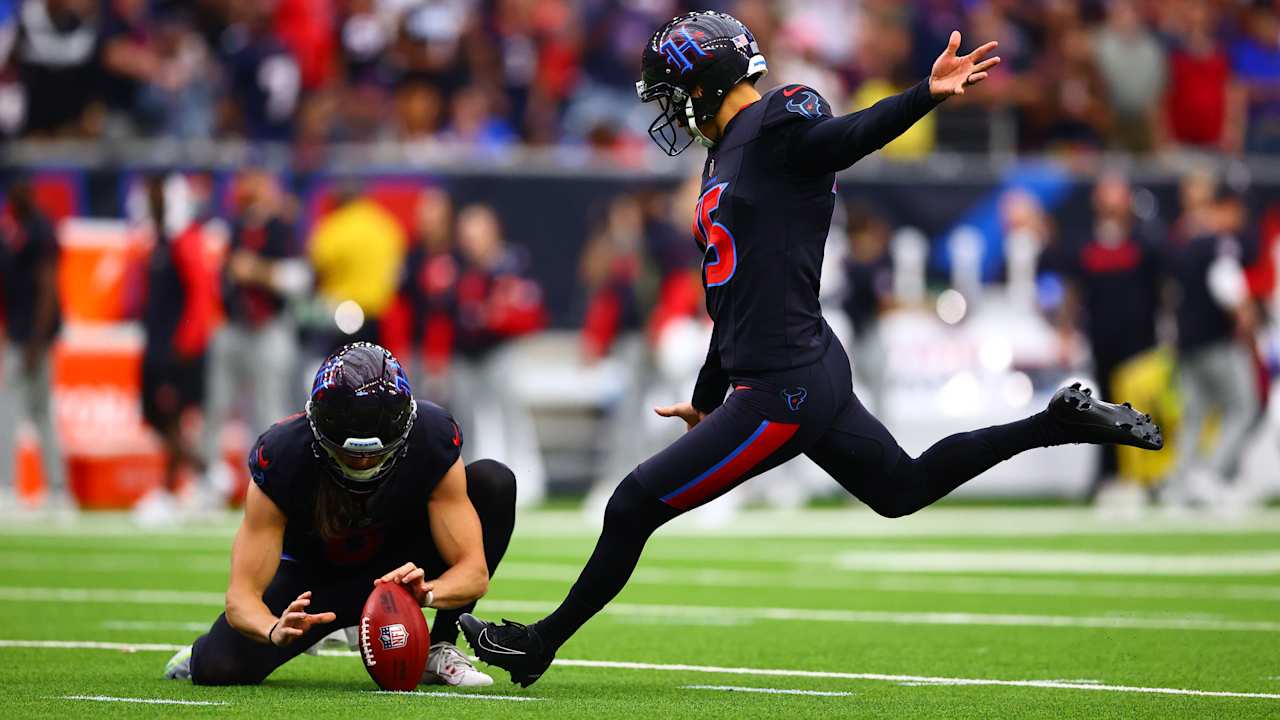
Ka'imi Fairbairn — Short–Mid Range leader (Rank 1)
Long-Range Volatility (50+ Yards)
High vs. Low Performers: Long-Distance Risk
Category
Rank
Kicker
50+
Longest
High Performer
5
Will Reichard
11–13
62
High Performer
4
Brandon Aubrey
11–17
64
Low Performer
8
Tyler Loop
1–4
52
Low Performer
11
Wil Lutz
4–6
57
Long-range kicking introduces the greatest variance.
Aubrey and Reichard attempt a high volume of 50+ yard kicks,
suggesting strong leg strength and coaching confidence,
even though accuracy declines compared to shorter distances.
Lower-ranked kickers such as Loop struggle significantly from long range,
converting only one of four attempts, which limits their strategic value
in late-game or end-of-half scenarios.
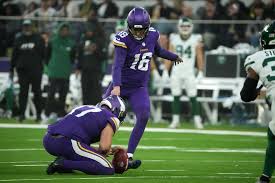
Will Reichard — Long-range performer (High volume & distance)
Overall Efficiency vs. Volume
Accuracy Discrepancy Across Total Attempts
Category
Rank
Kicker
FGM
FGA
FG%
High Efficiency
11
Nick Folk
28
29
96.6%
High Volume
1
Ka'imi Fairbairn
44
48
91.7%
Low Efficiency
10
Blake Grupe
29
37
78.4%
High efficiency does not always correlate with high ranking.
Nick Folk’s elite accuracy is offset by lower attempt volume,
while Fairbairn combines both volume and efficiency to lead the league.
Conversely, Grupe’s lower accuracy across a similar workload
illustrates how missed opportunities compound over a season,
directly impacting team scoring reliability.
Nick Folk — Highest efficiency (96.6%)
Glossary - Hover over terms
RK
Rank — overall position based on selected metrics.
FGM
Field Goals Made — total successful field goals.
FGA
Field Goal Attempts — total field goal attempts.
FG%
Field Goal Percentage — FGM divided by FGA, expressed as a percentage.
LNG
Longest — the longest successful field goal (yards).
20–29 / 30–39 / 40–49 / 50+
Accuracy ranges — number of successful field goals and attempts in each yard range.